
Maps are treated here as measured evidence, not as illustrations of a conclusion. Each figure must make clear which coordinates, distances, bearings or geometric relationships are being shown, and which interpretation remains unproven.
This page is the public gateway to the principal ArchaeoLocus map and evidence sets. High-resolution publication figures, raw tables and reproducibility packages are released only when journal, magazine, image-rights, data-provenance and archaeological-sensitivity conditions permit.
Current studies
Aphaia · Apollo · Theatre Orientation
Map principle
Calibrated, measured and captioned
Release status
Project evidence public · full figure packages controlled
01
What a map is allowed to claim
A line on an ArchaeoLocus map records a defined spatial relationship. It does not, by itself, establish that ancient people intended, surveyed, saw or coordinated that relationship.
Map captions therefore distinguish measured geometry from historical interpretation. Where a line is a geodesic between site coordinates, it is identified as such. Where an architectural axis, cross-track offset, uncertainty envelope or sensitivity-only relationship is shown, that distinction is also stated explicitly.
02
Aphaia-centred Attic-Saronic evidence
The publication-core map set is built around six archaeological locations and the Sanctuary of Aphaia Athena as the tested apex. Two near-isosceles structures survive at the strict 0.1% triangle tolerance: the shorter Aphaia–Vravron–Sounion structure at approximately 44.75 km from Aphaia, and the longer Aphaia–Heraion of the Argolid–Heraion of Perachora structure at approximately 67 km.
A second figure layer explains the declared distance ladder: 44.75 km, 67.12 km and 100.69 km. The approximately 100.68 km Heraion of Perachora–Vravron distance is an outer cross-link completing the 2.25D level; it is not presented as another radial spoke from Aphaia.
- Core overview: six locations and the two surviving Aphaia-apex structures.
- Distance-ladder figure: D = 44.75 km, 1.5D = 67.12 km and 2.25D = 100.69 km.
- Control evidence: the Aphaia-centred result is interpreted alongside the no-Aphaia and alternative-target controls rather than from the map alone.
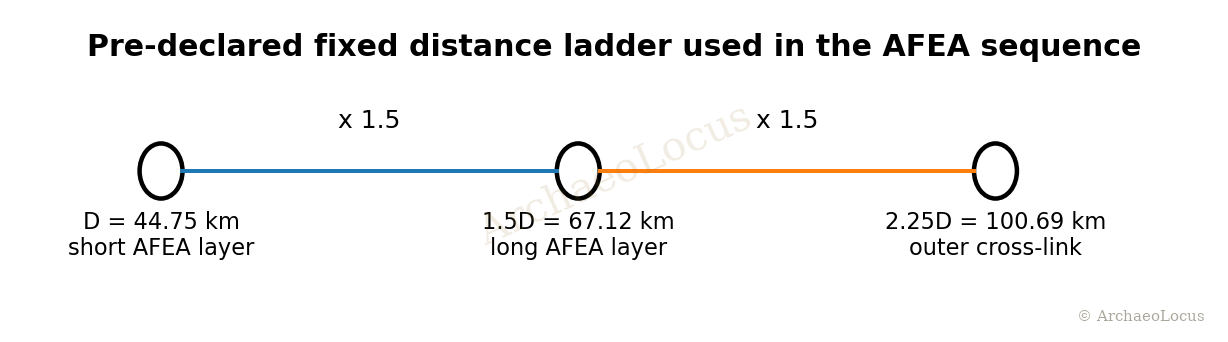
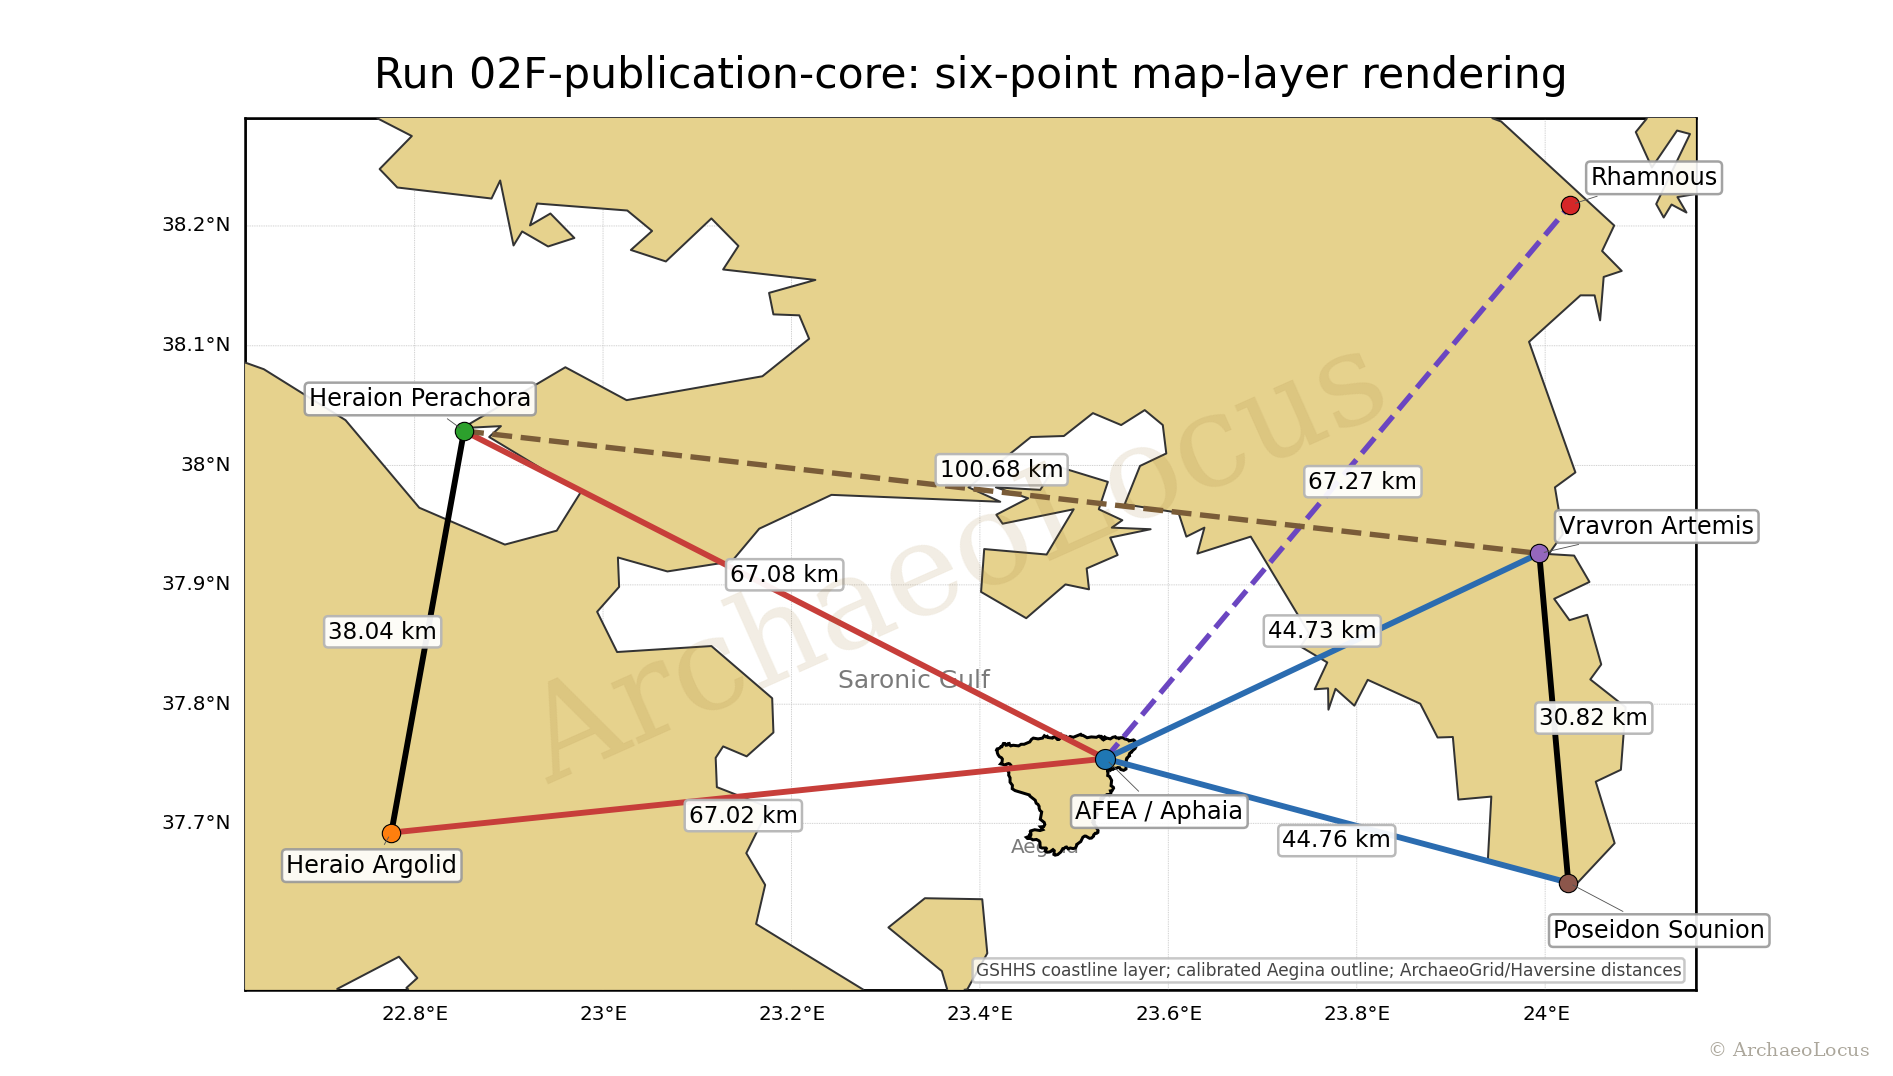
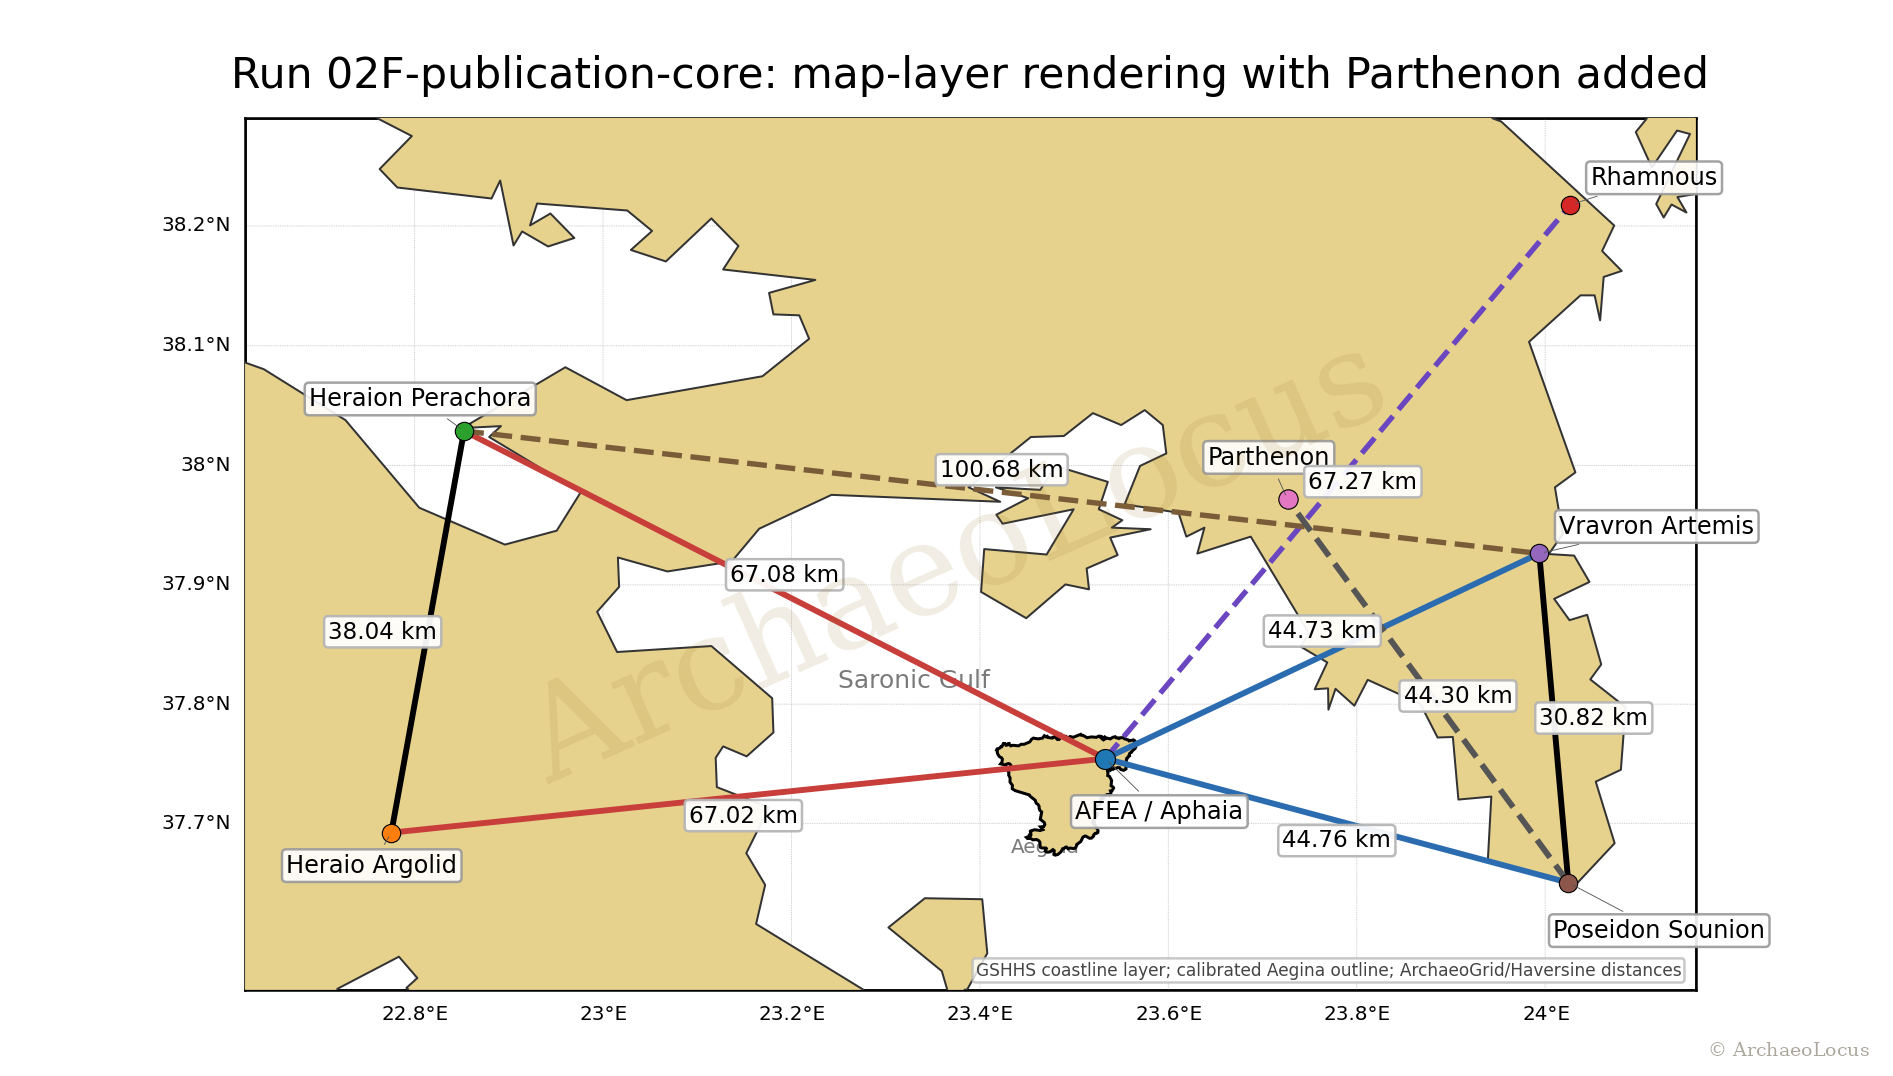
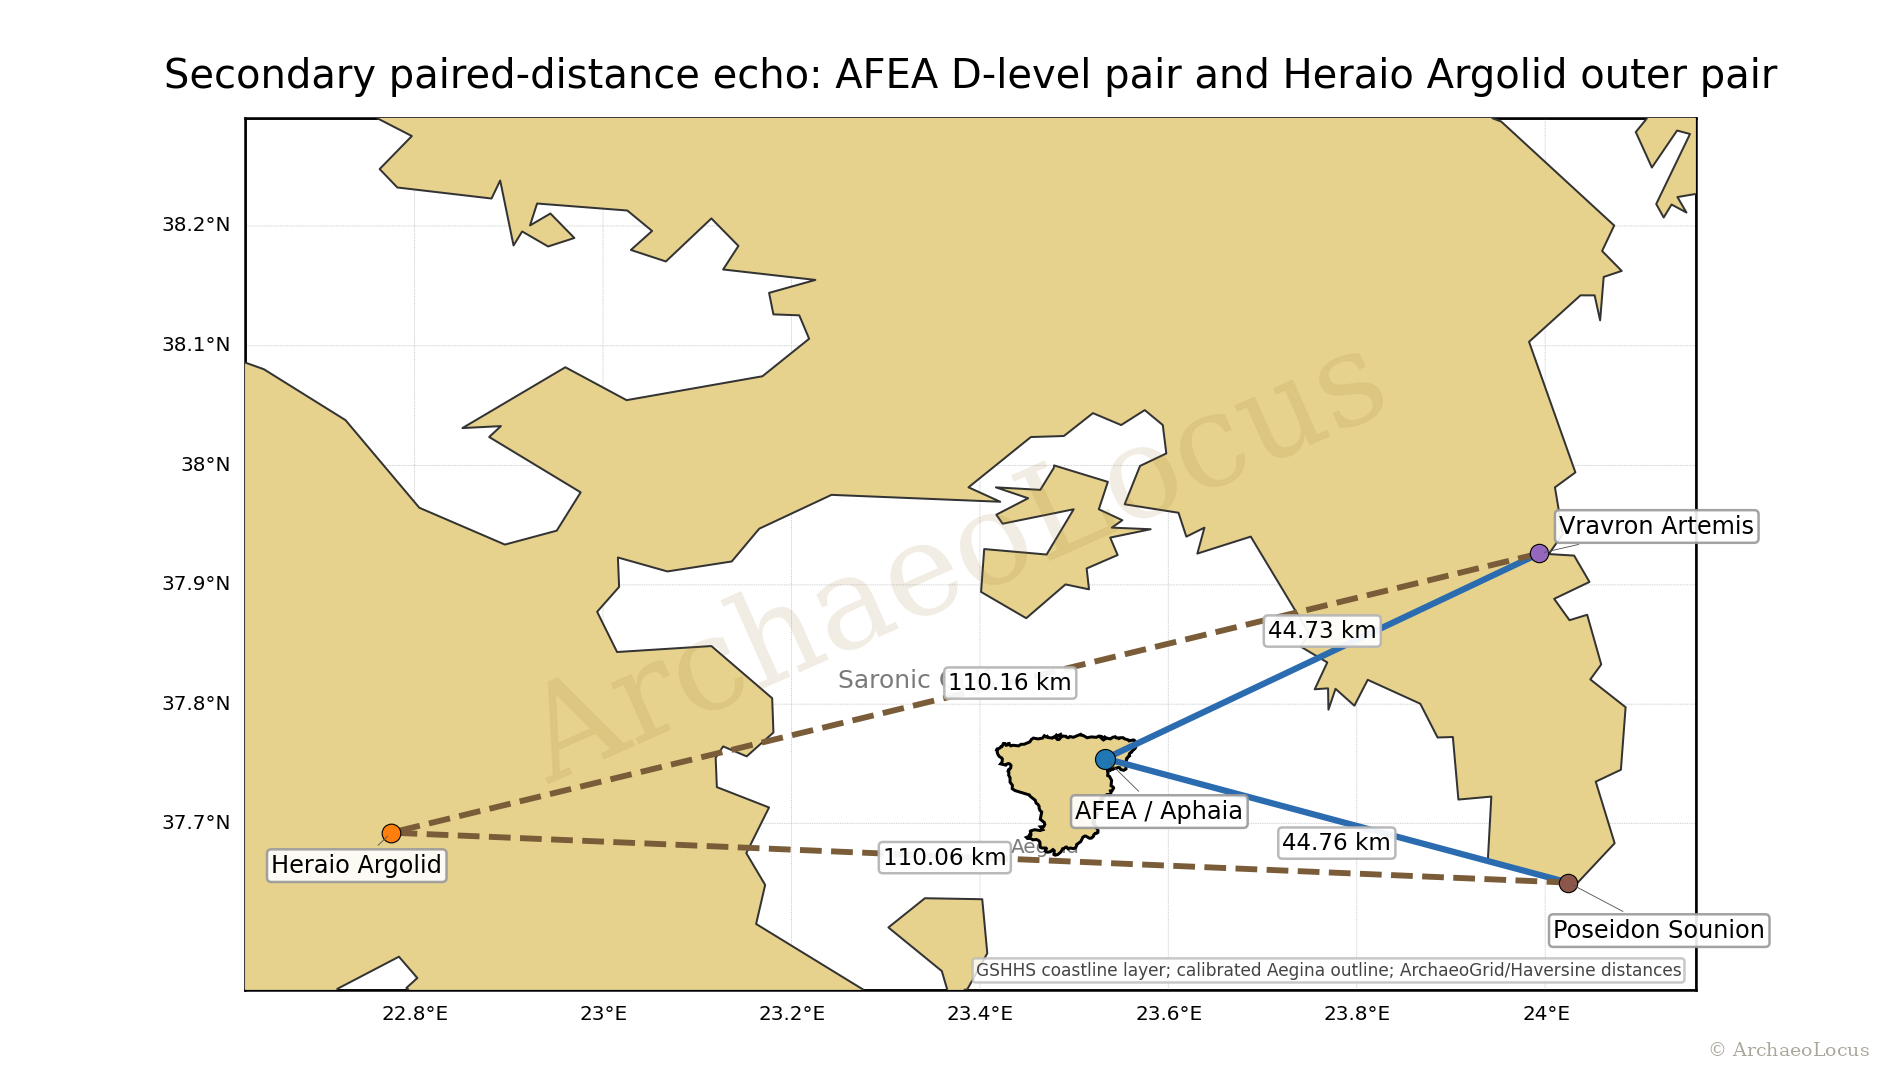
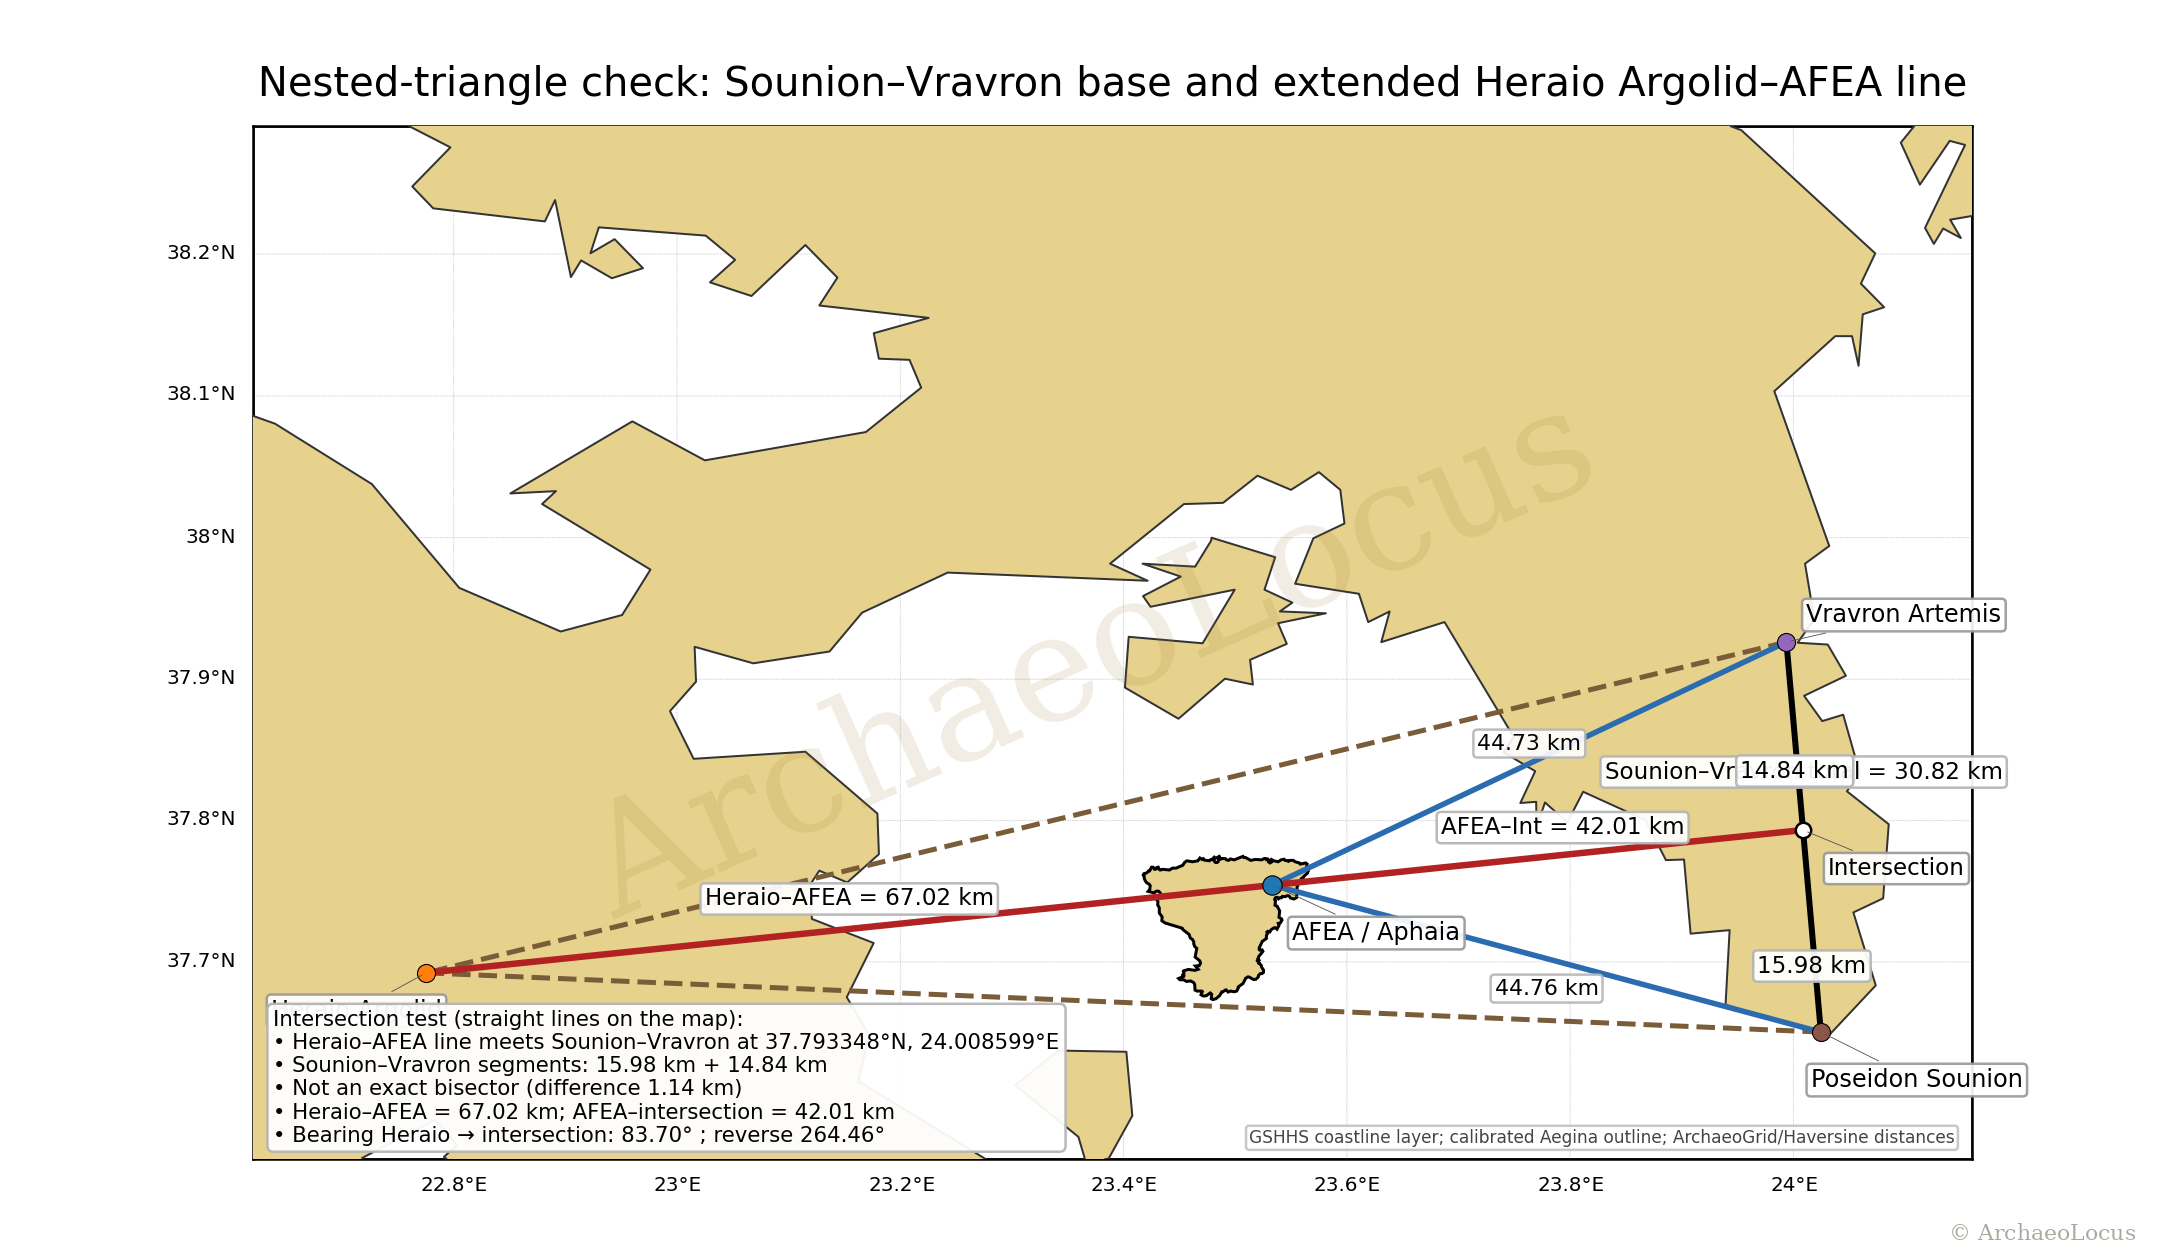
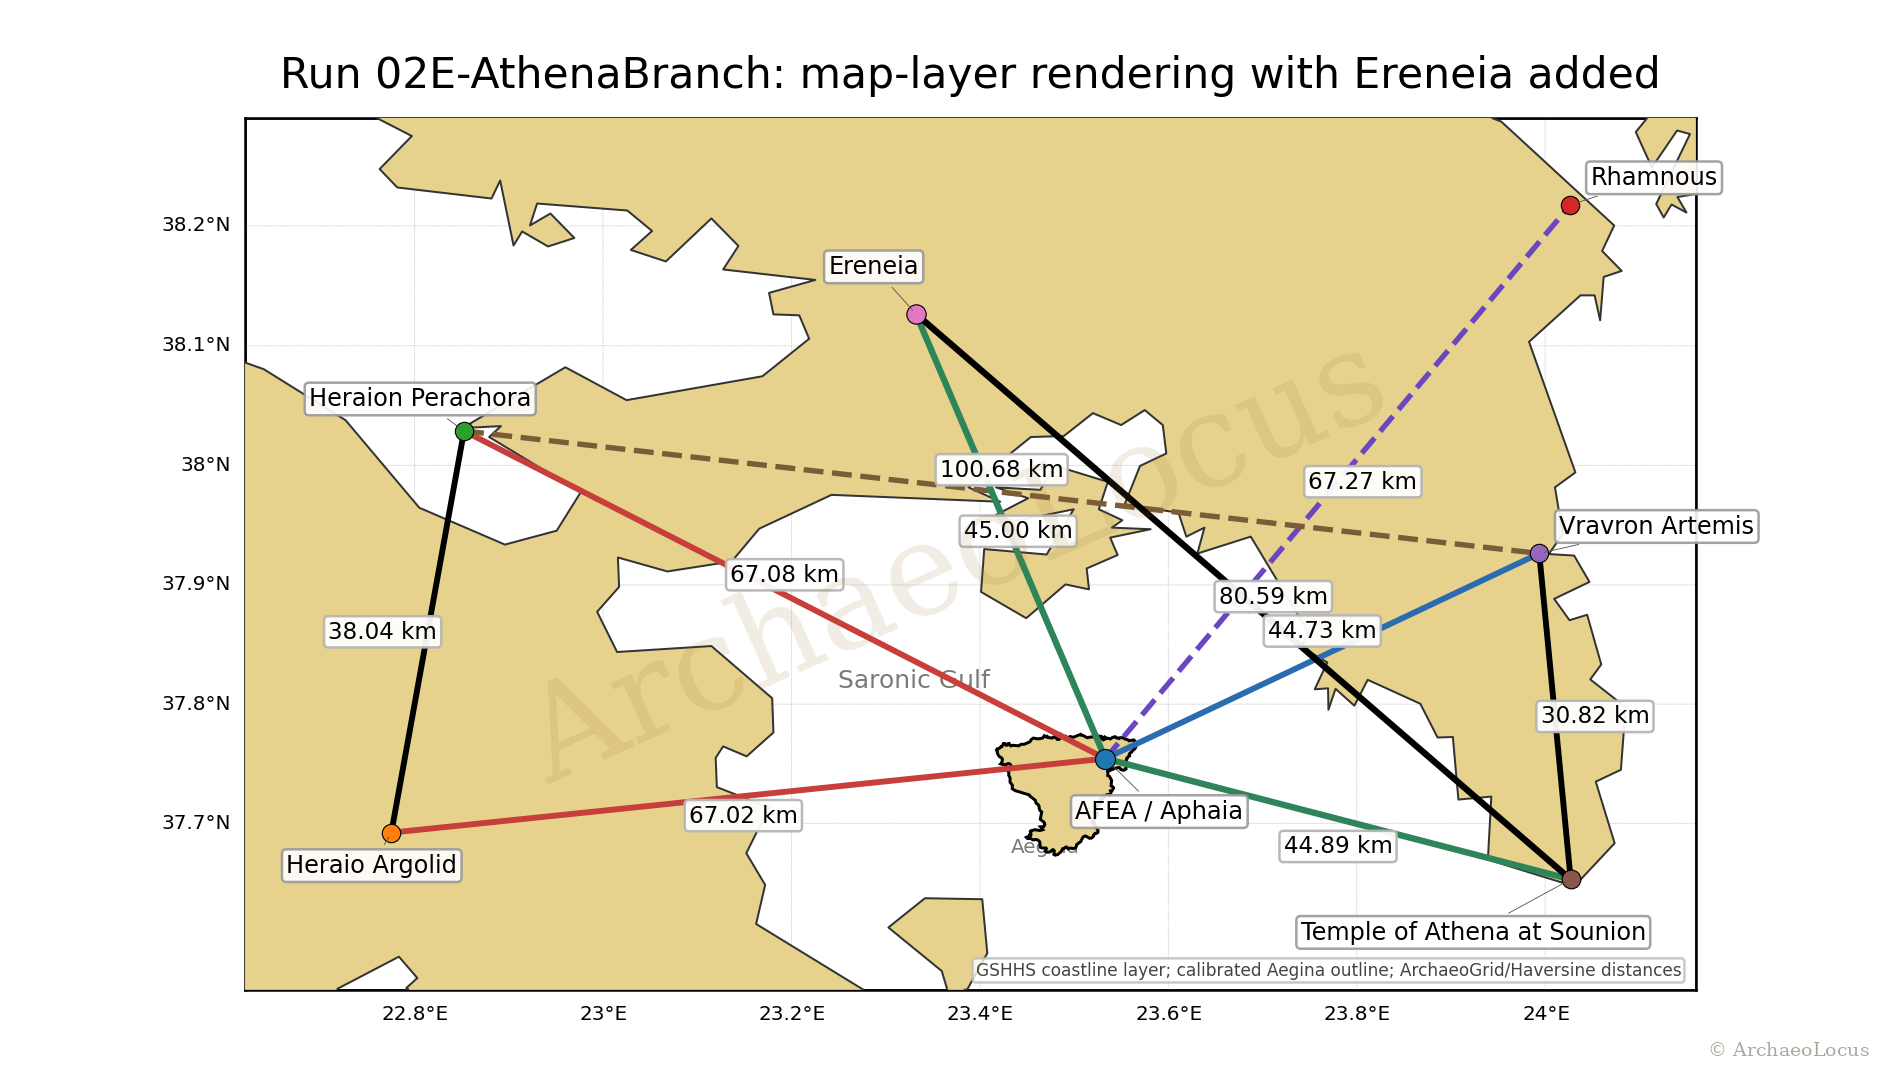
Aphaia figures reproduced from the approved public-paper figure set. Core, control, secondary and branch material remain explicitly separated.
03
Apollo-associated lattice evidence
The frozen Apollo core uses seven anchors: Delphi, Sardeis, Bassae, Didyma, Tainaron, Apollo Erethymios and Delos. Its principal map shows the declared three near-east/west rails, two near-north/south sides and the position of Delos near the finite Bassae–Didyma middle rail.
The map belongs to a seven-condition statistical model. The observed configuration scored 7 / 7, but the figure is not presented as visual proof: the inferential evidence comes from the frozen conditions, one million fixed-role permutations, coordinate-uncertainty tests, holdouts and matched controls.
- Frozen lattice map: the seven anchors and declared rail/side geometry.
- Uncertainty evidence: representative-coordinate and coordinate-jitter robustness are recorded separately from the visual map.
- Delos-centred secondary geometry: the approximately 271 km radii and associated near-equalities are shown only as secondary measured geometry, not silently added to the primary 7 / 7 score.
- Adverse evidence: the Delos holdout replacement and incomplete matched-control condition remain part of the evidence record.
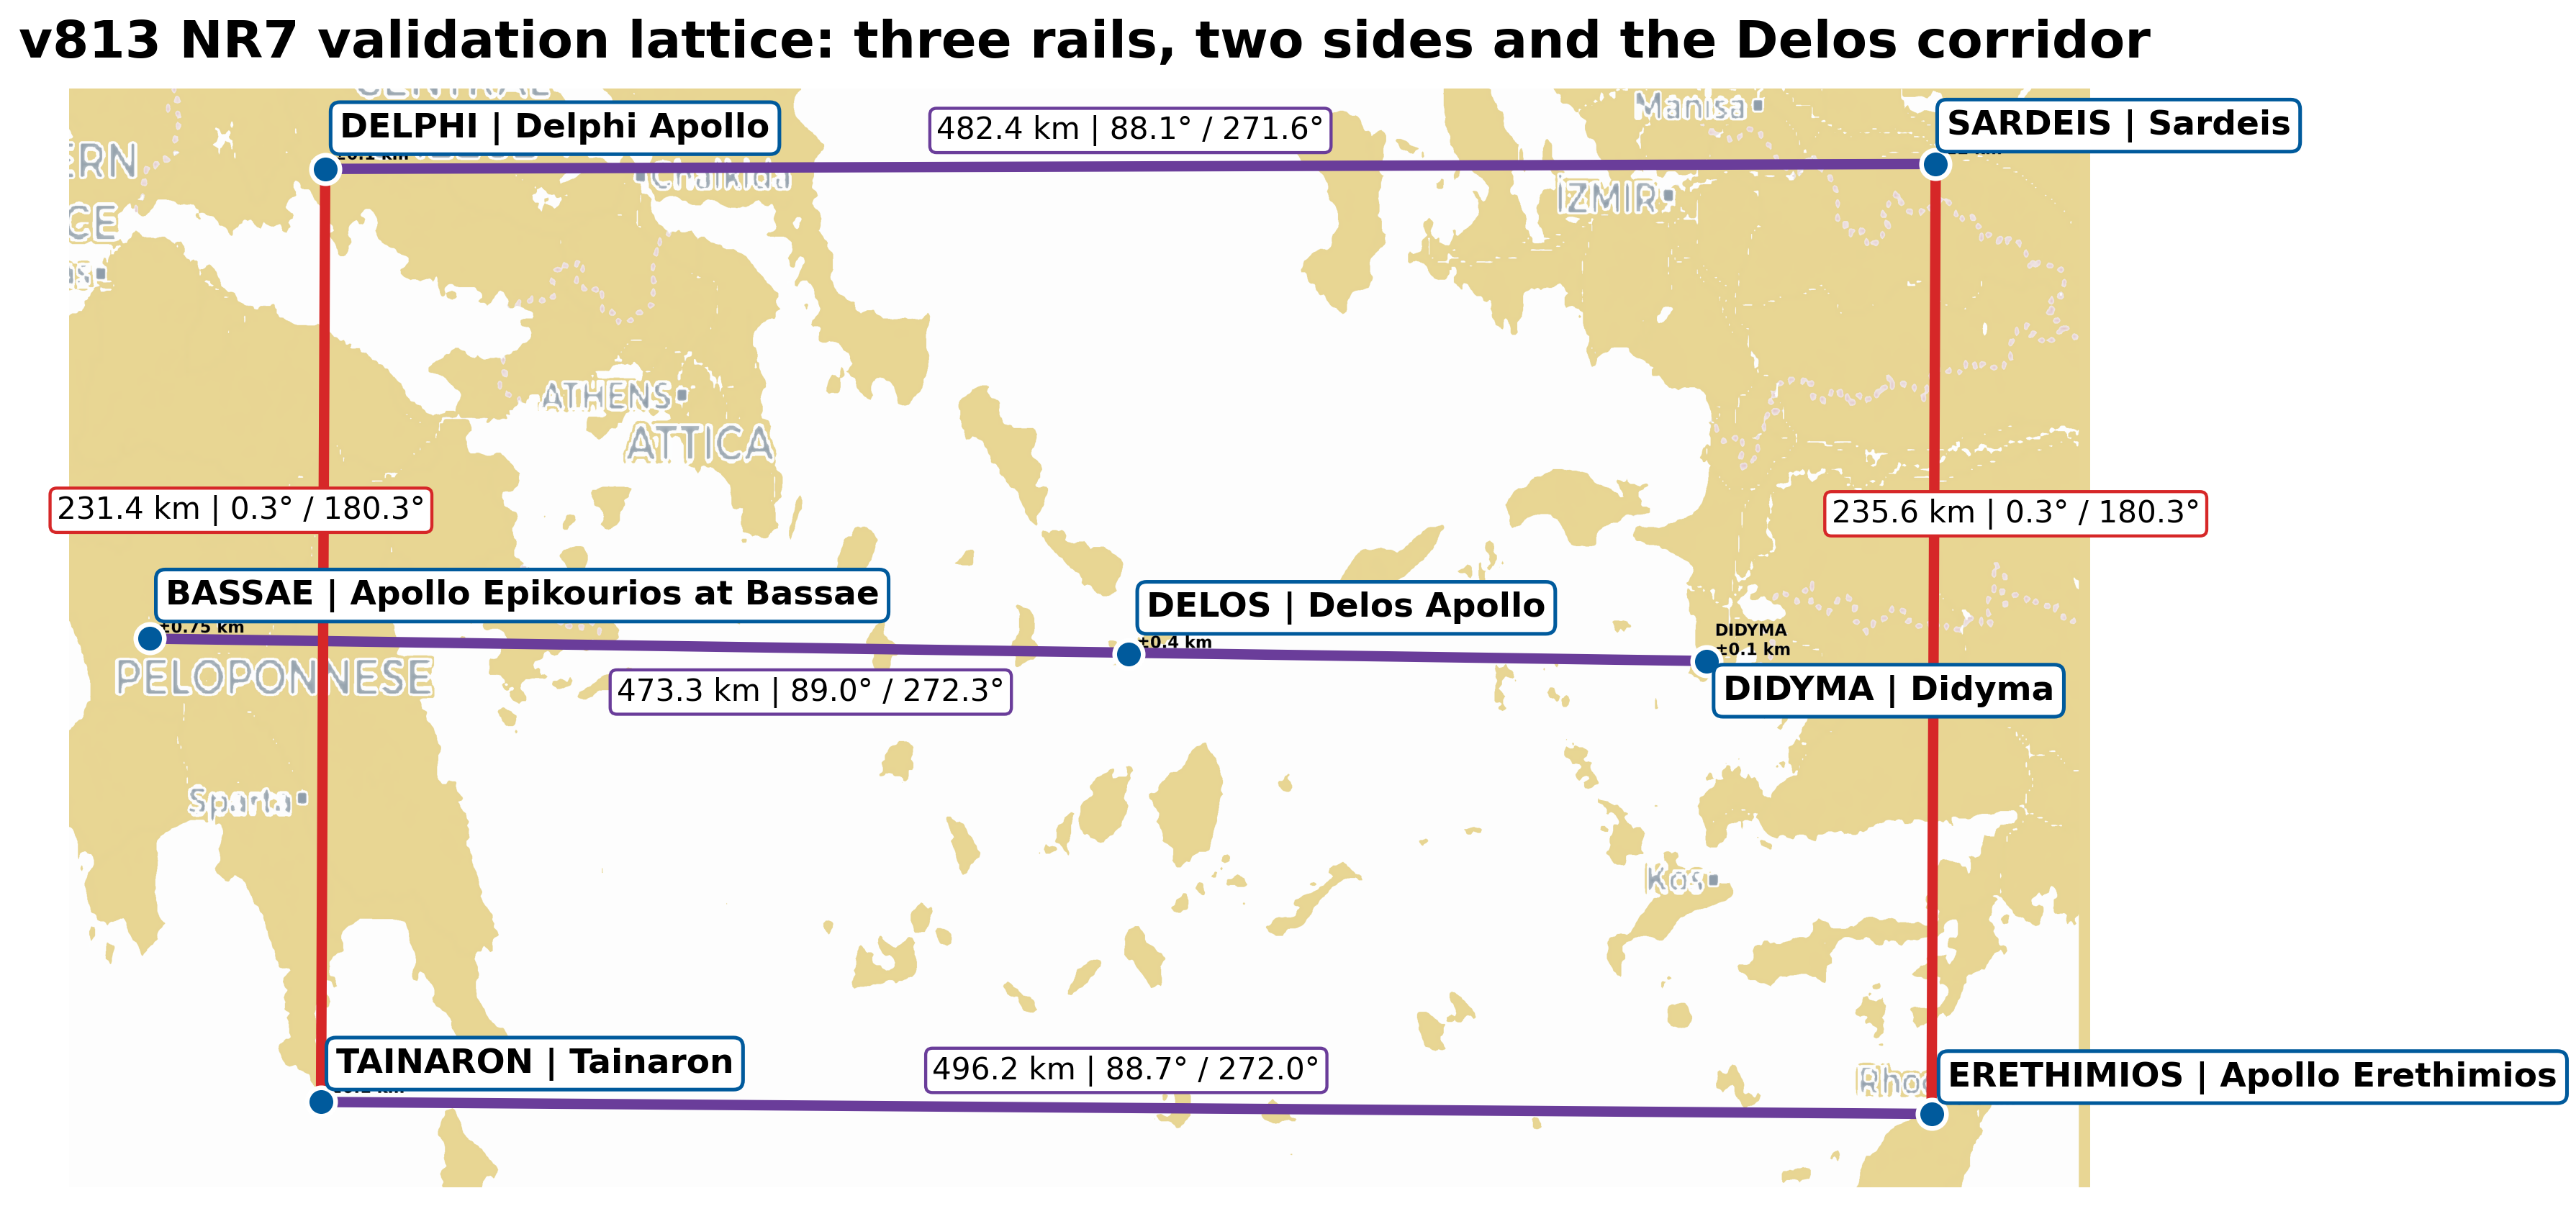
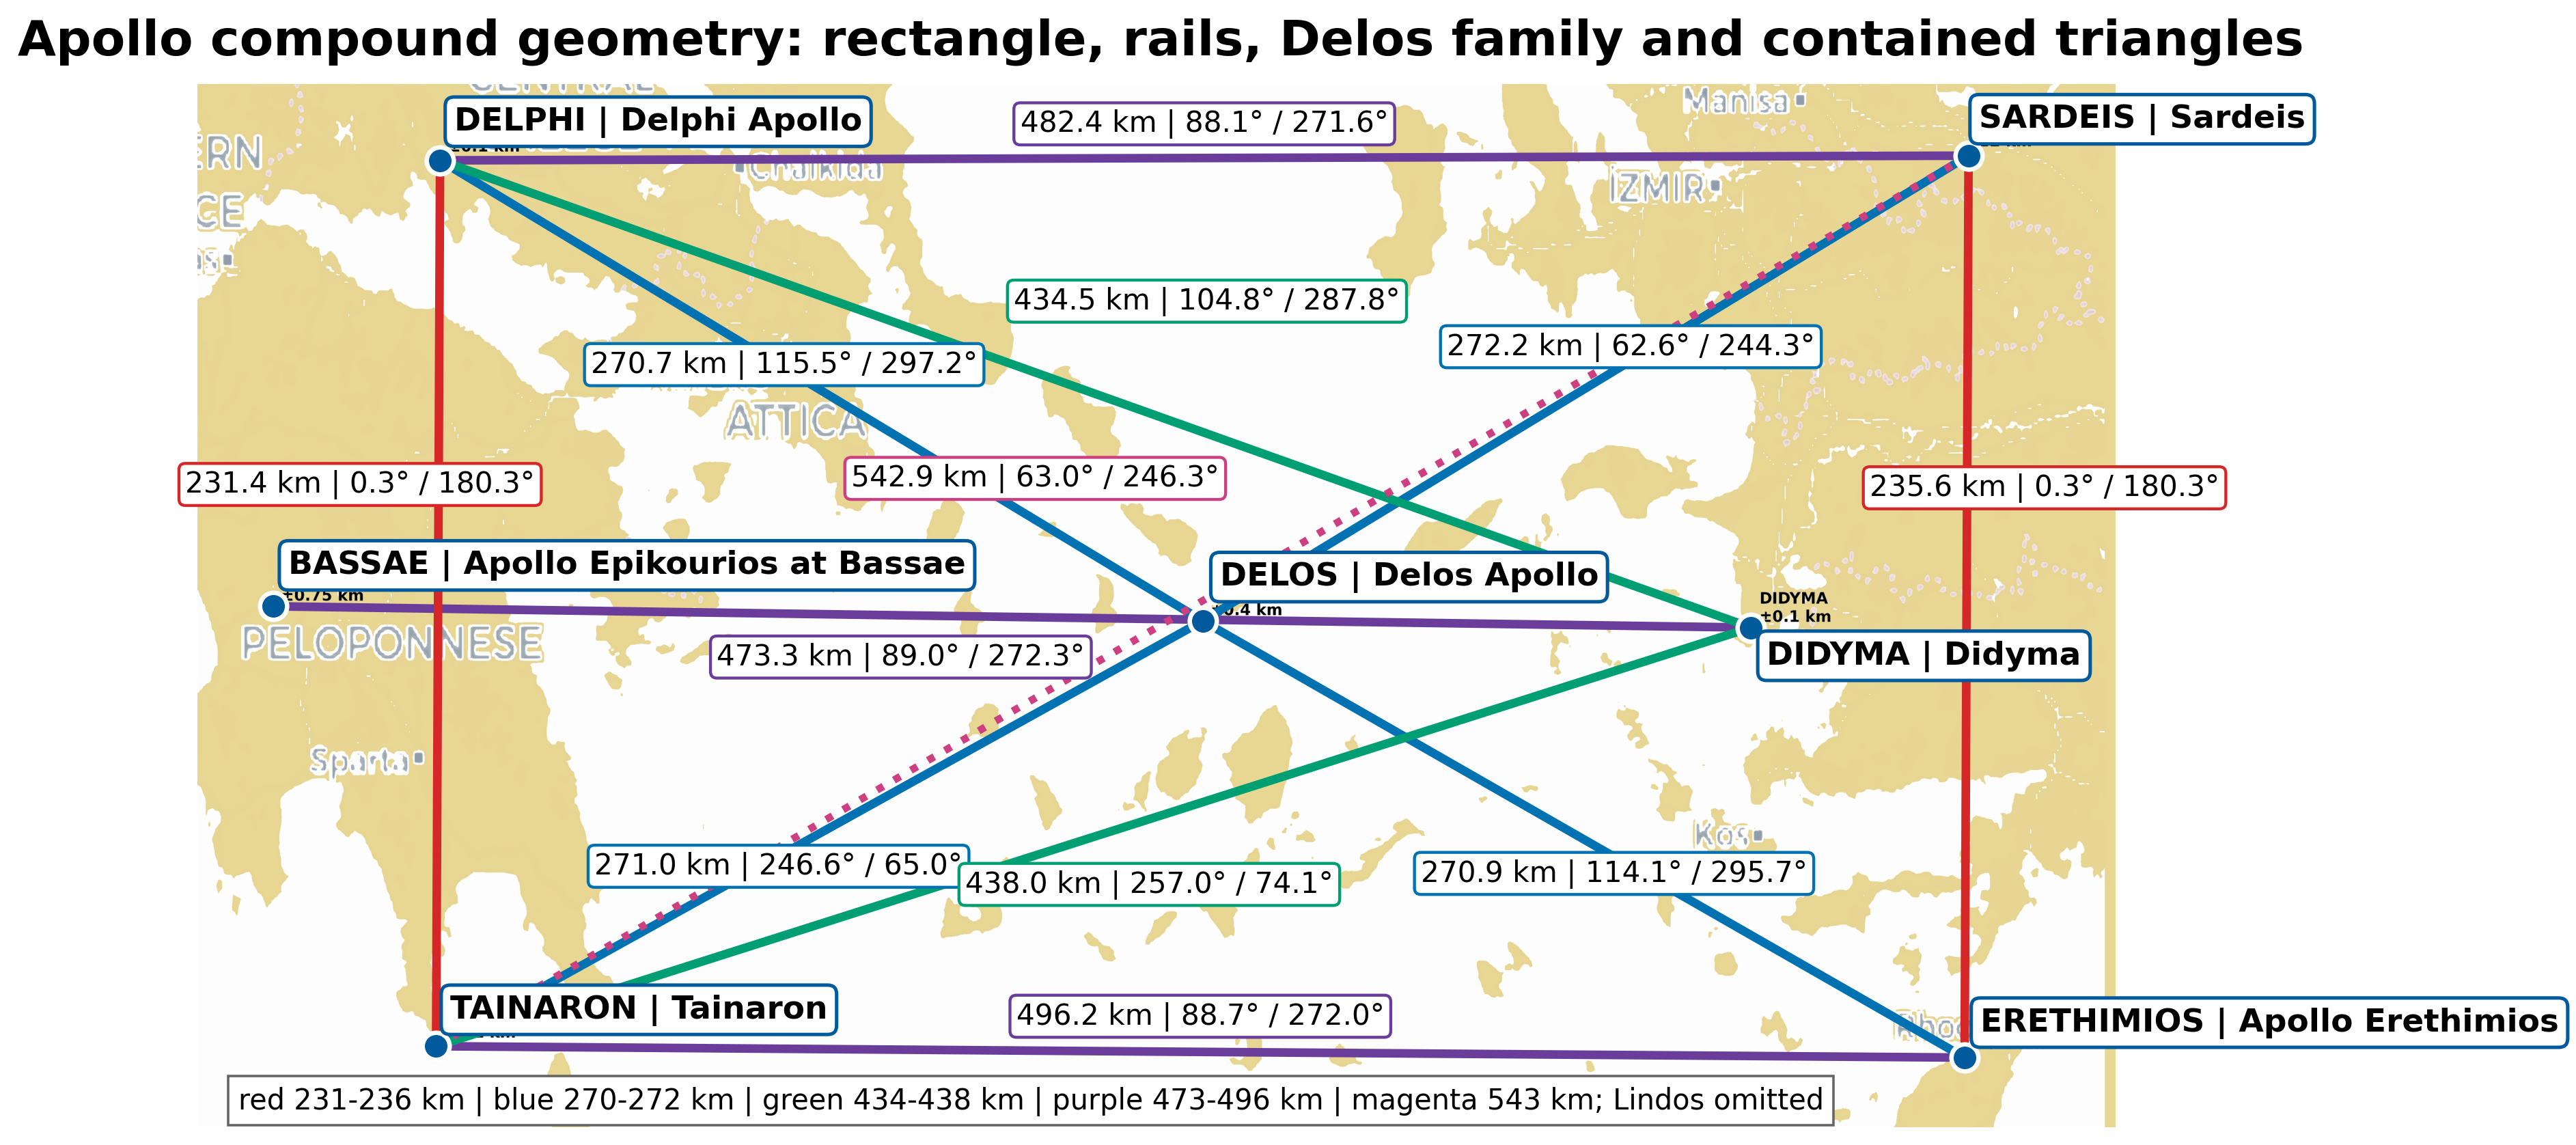
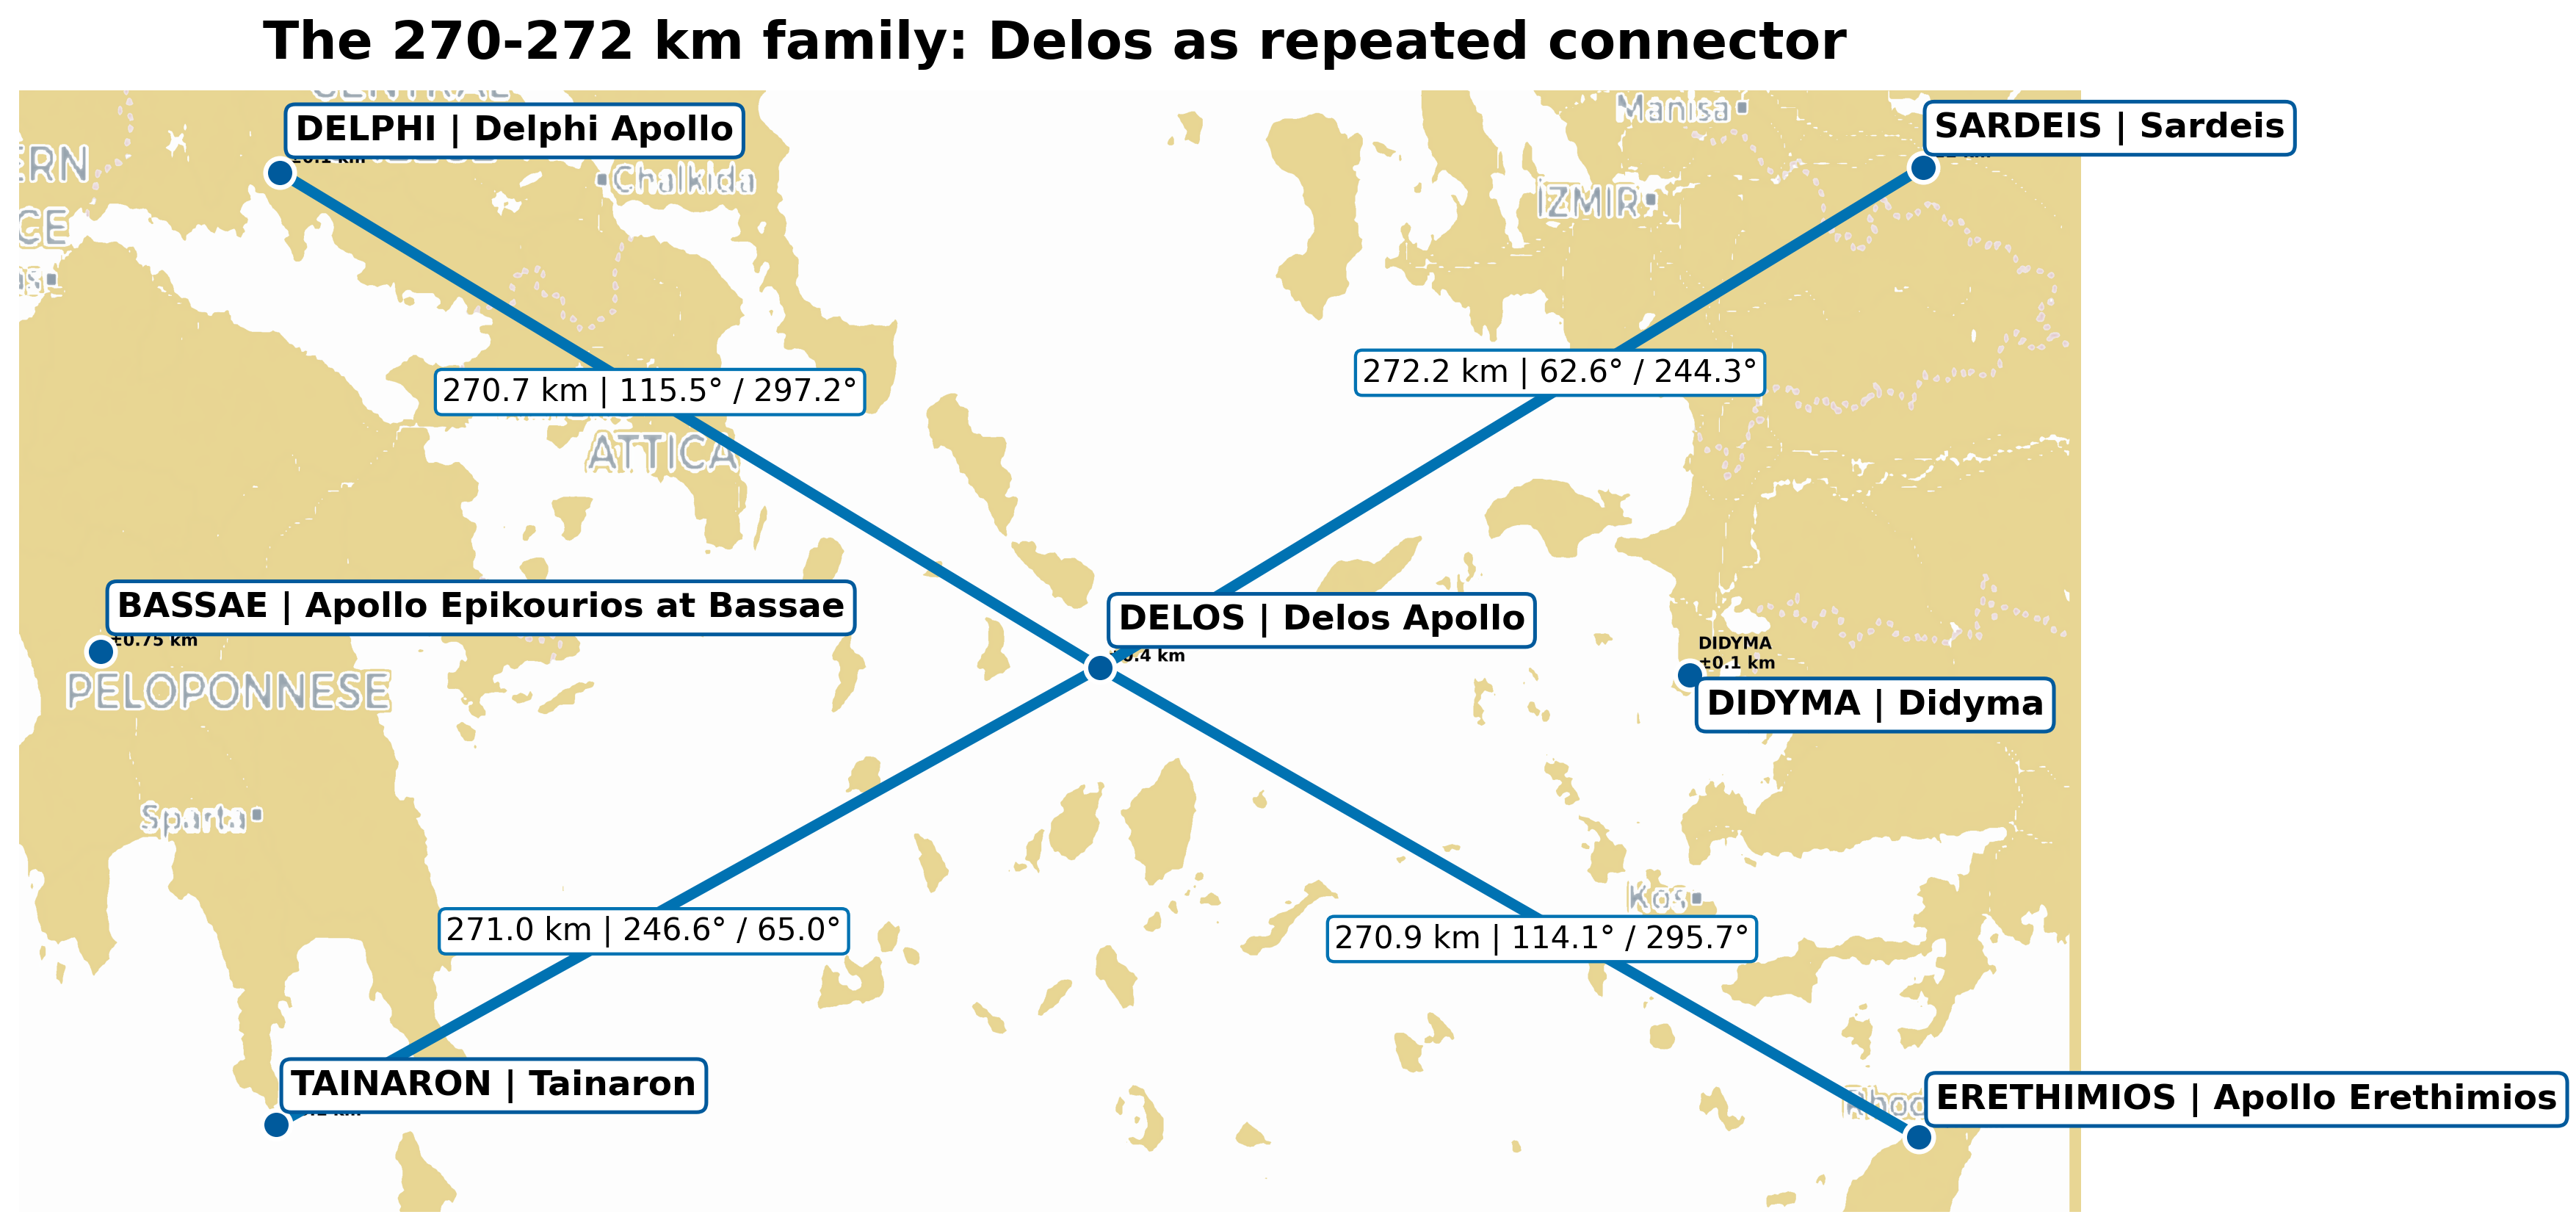
Apollo figures retain the frozen validation/map baseline. Later coordinate or identity audits are handled prospectively and are not silently back-propagated into the frozen scientific result.
04
Theatre Orientation evidence
The theatre map suite keeps two geometries separate. One is the WGS84 geodesic joining the theatre centres of Epidaurus and Delphi, with Corinth lying approximately 95 metres from that line. The other is the measured audience-facing architectural axis of the Great Theatre of Epidaurus at 332.056°, which follows the same north-western corridor closely but is not identical to the theatre-centre geodesic.
- Corridor map: Epidaurus–Delphi theatre-centre geodesic compared with the surveyed Epidaurus architectural axis.
- Cross-track figure: the approximately 95 m displacement of Corinth from the Epidaurus–Delphi geodesic.
- Corpus context: the focal triplet shown within the complete 58-theatre analysis rather than in isolation.
- Statistical context: the general inter-theatre network was not demonstrated, and the Run 01C compound result does not survive corrected significance.
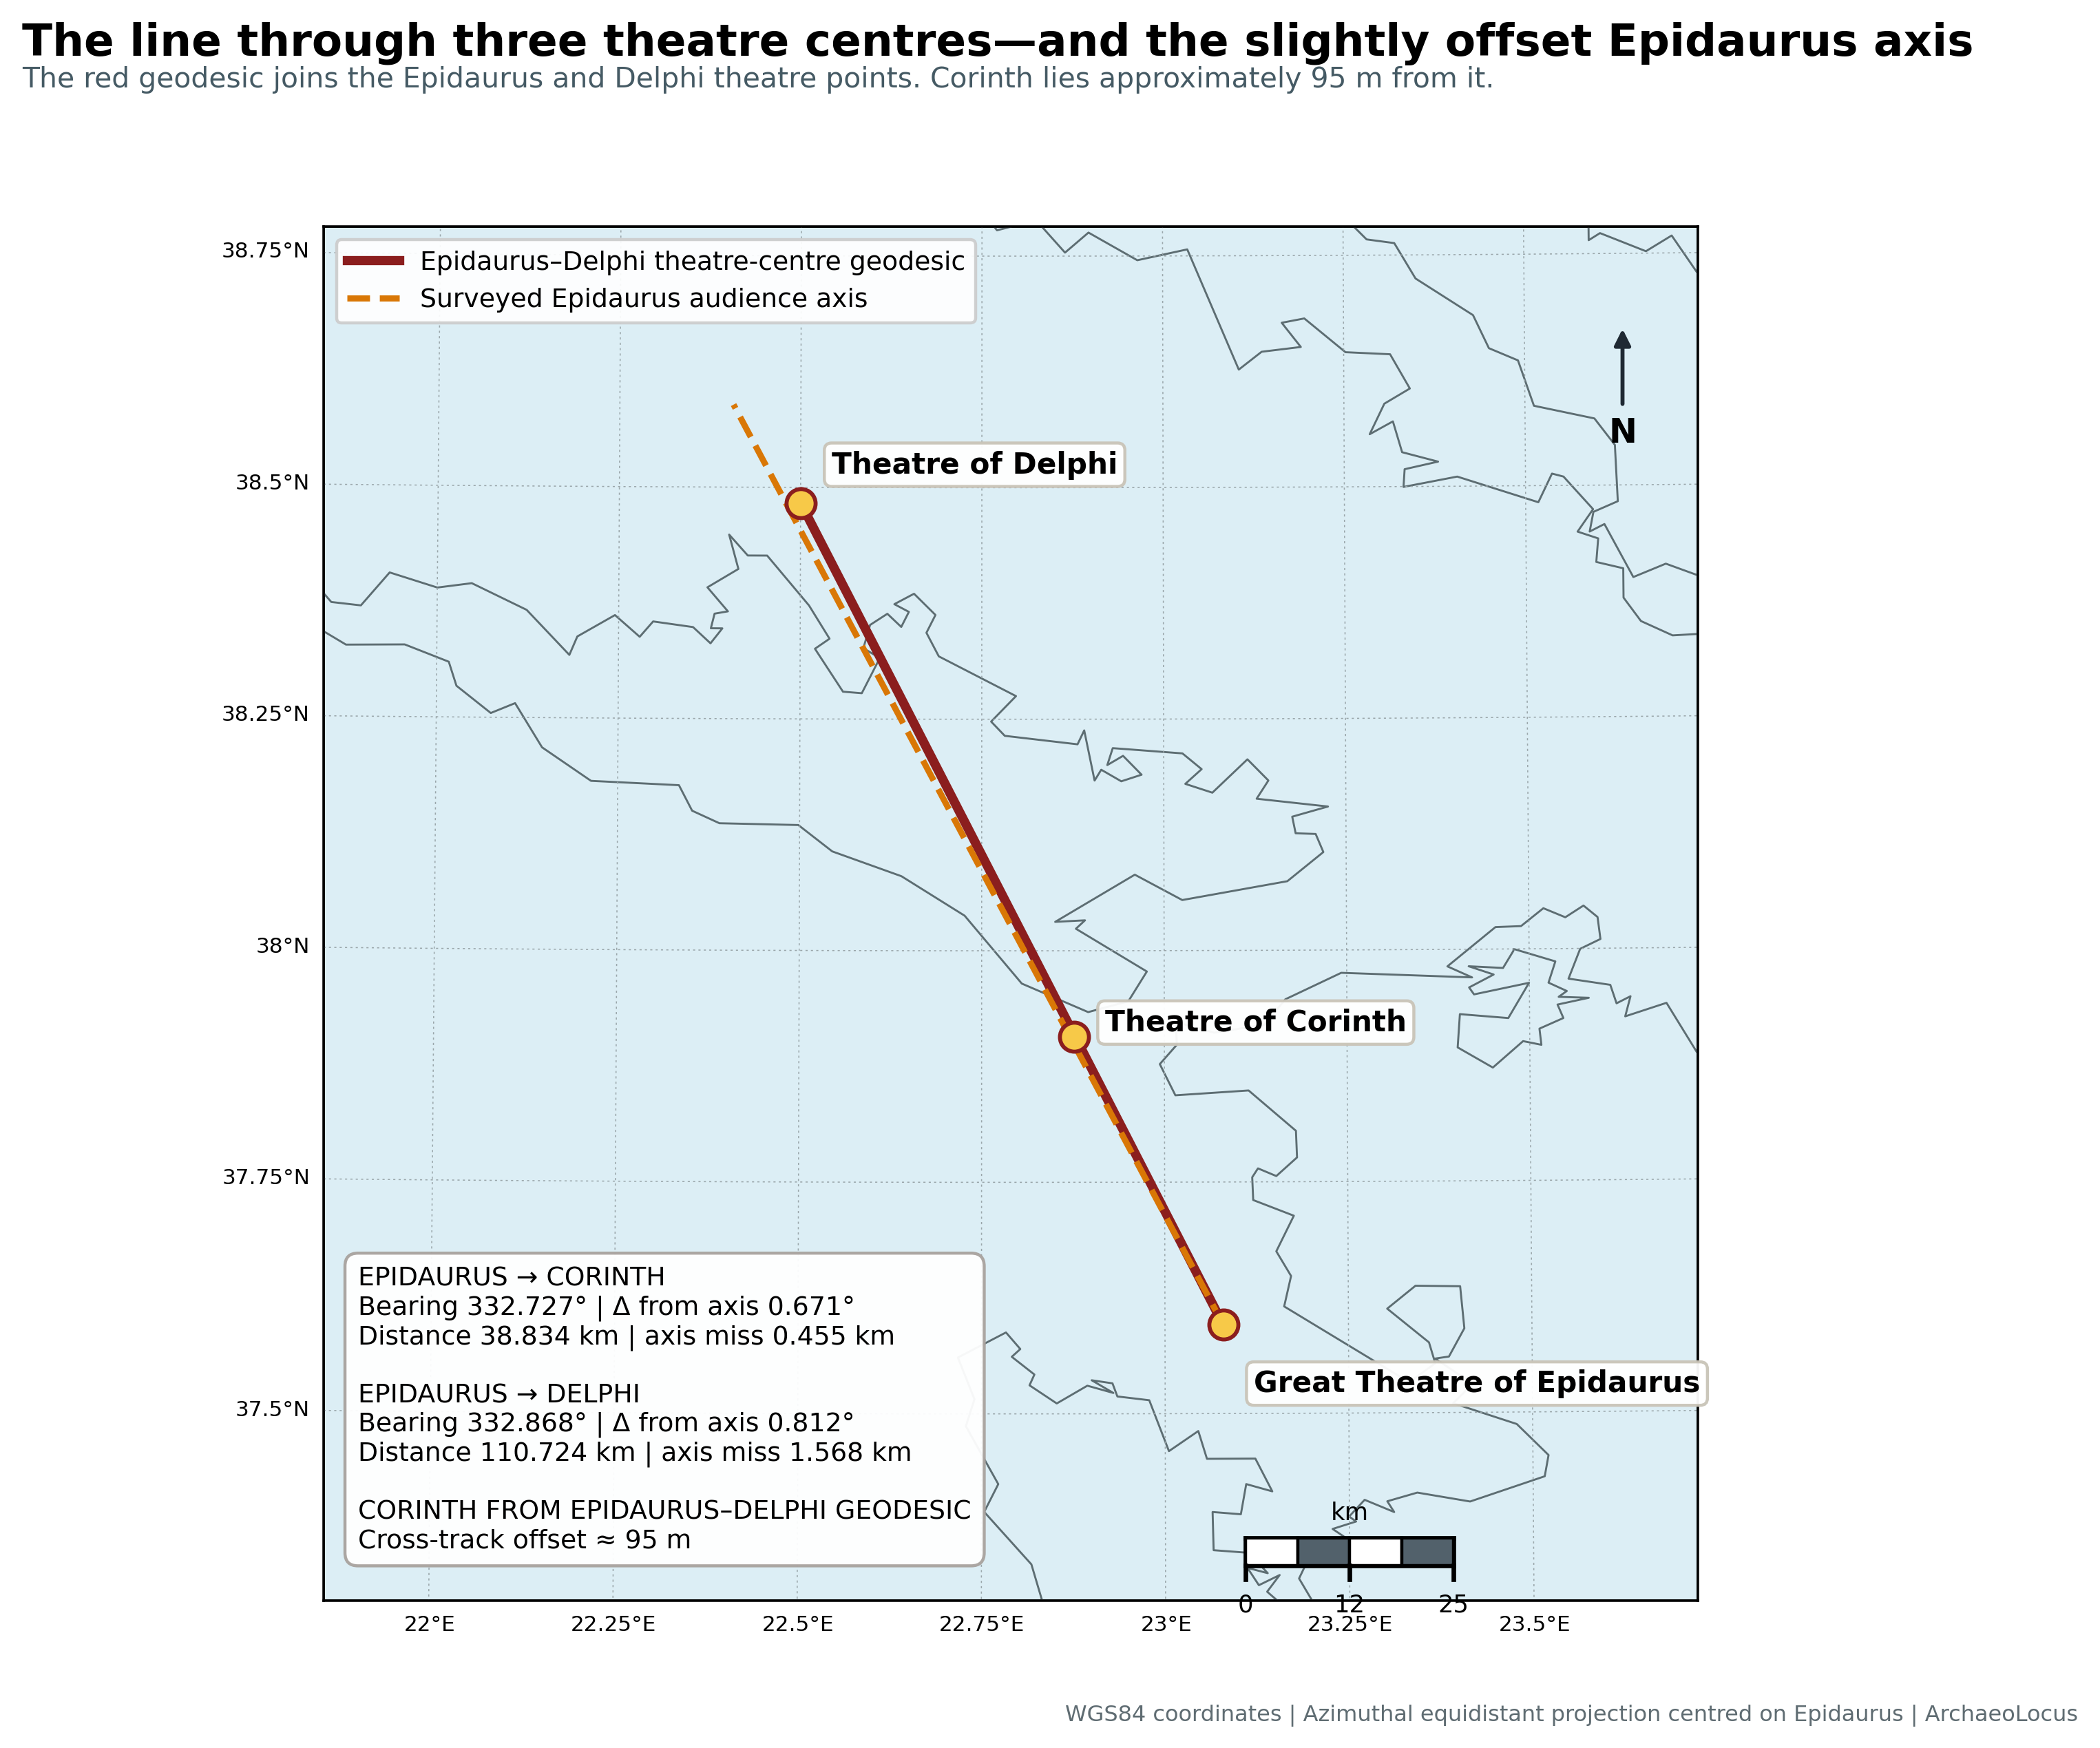
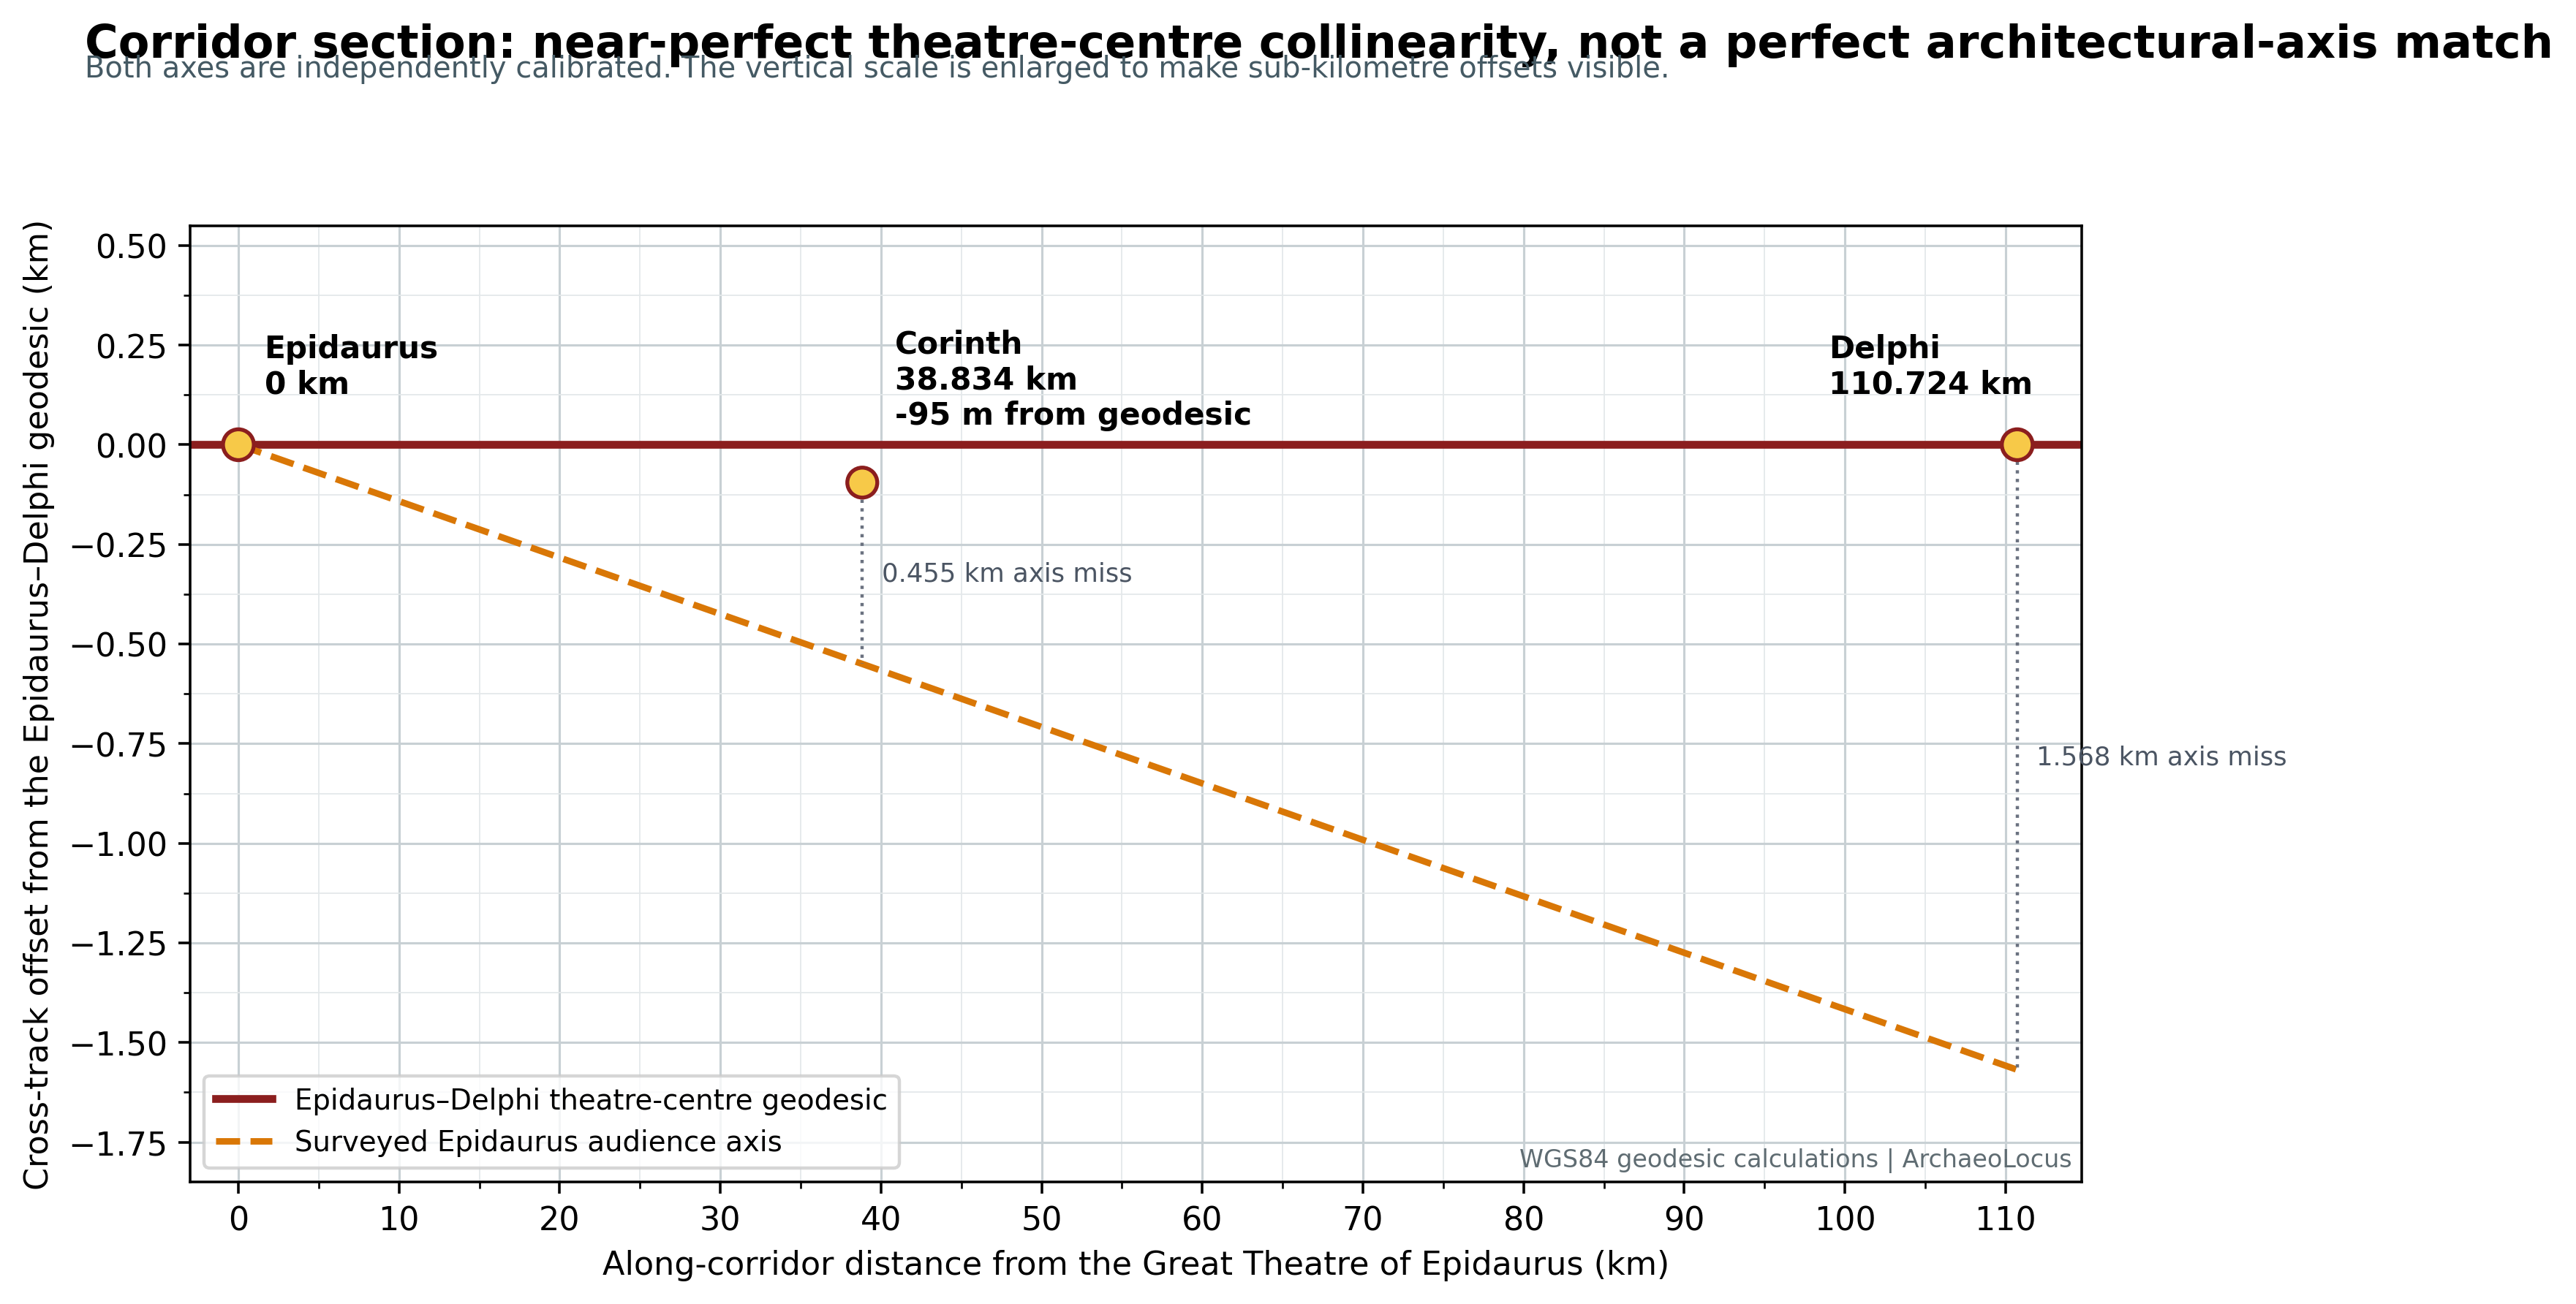
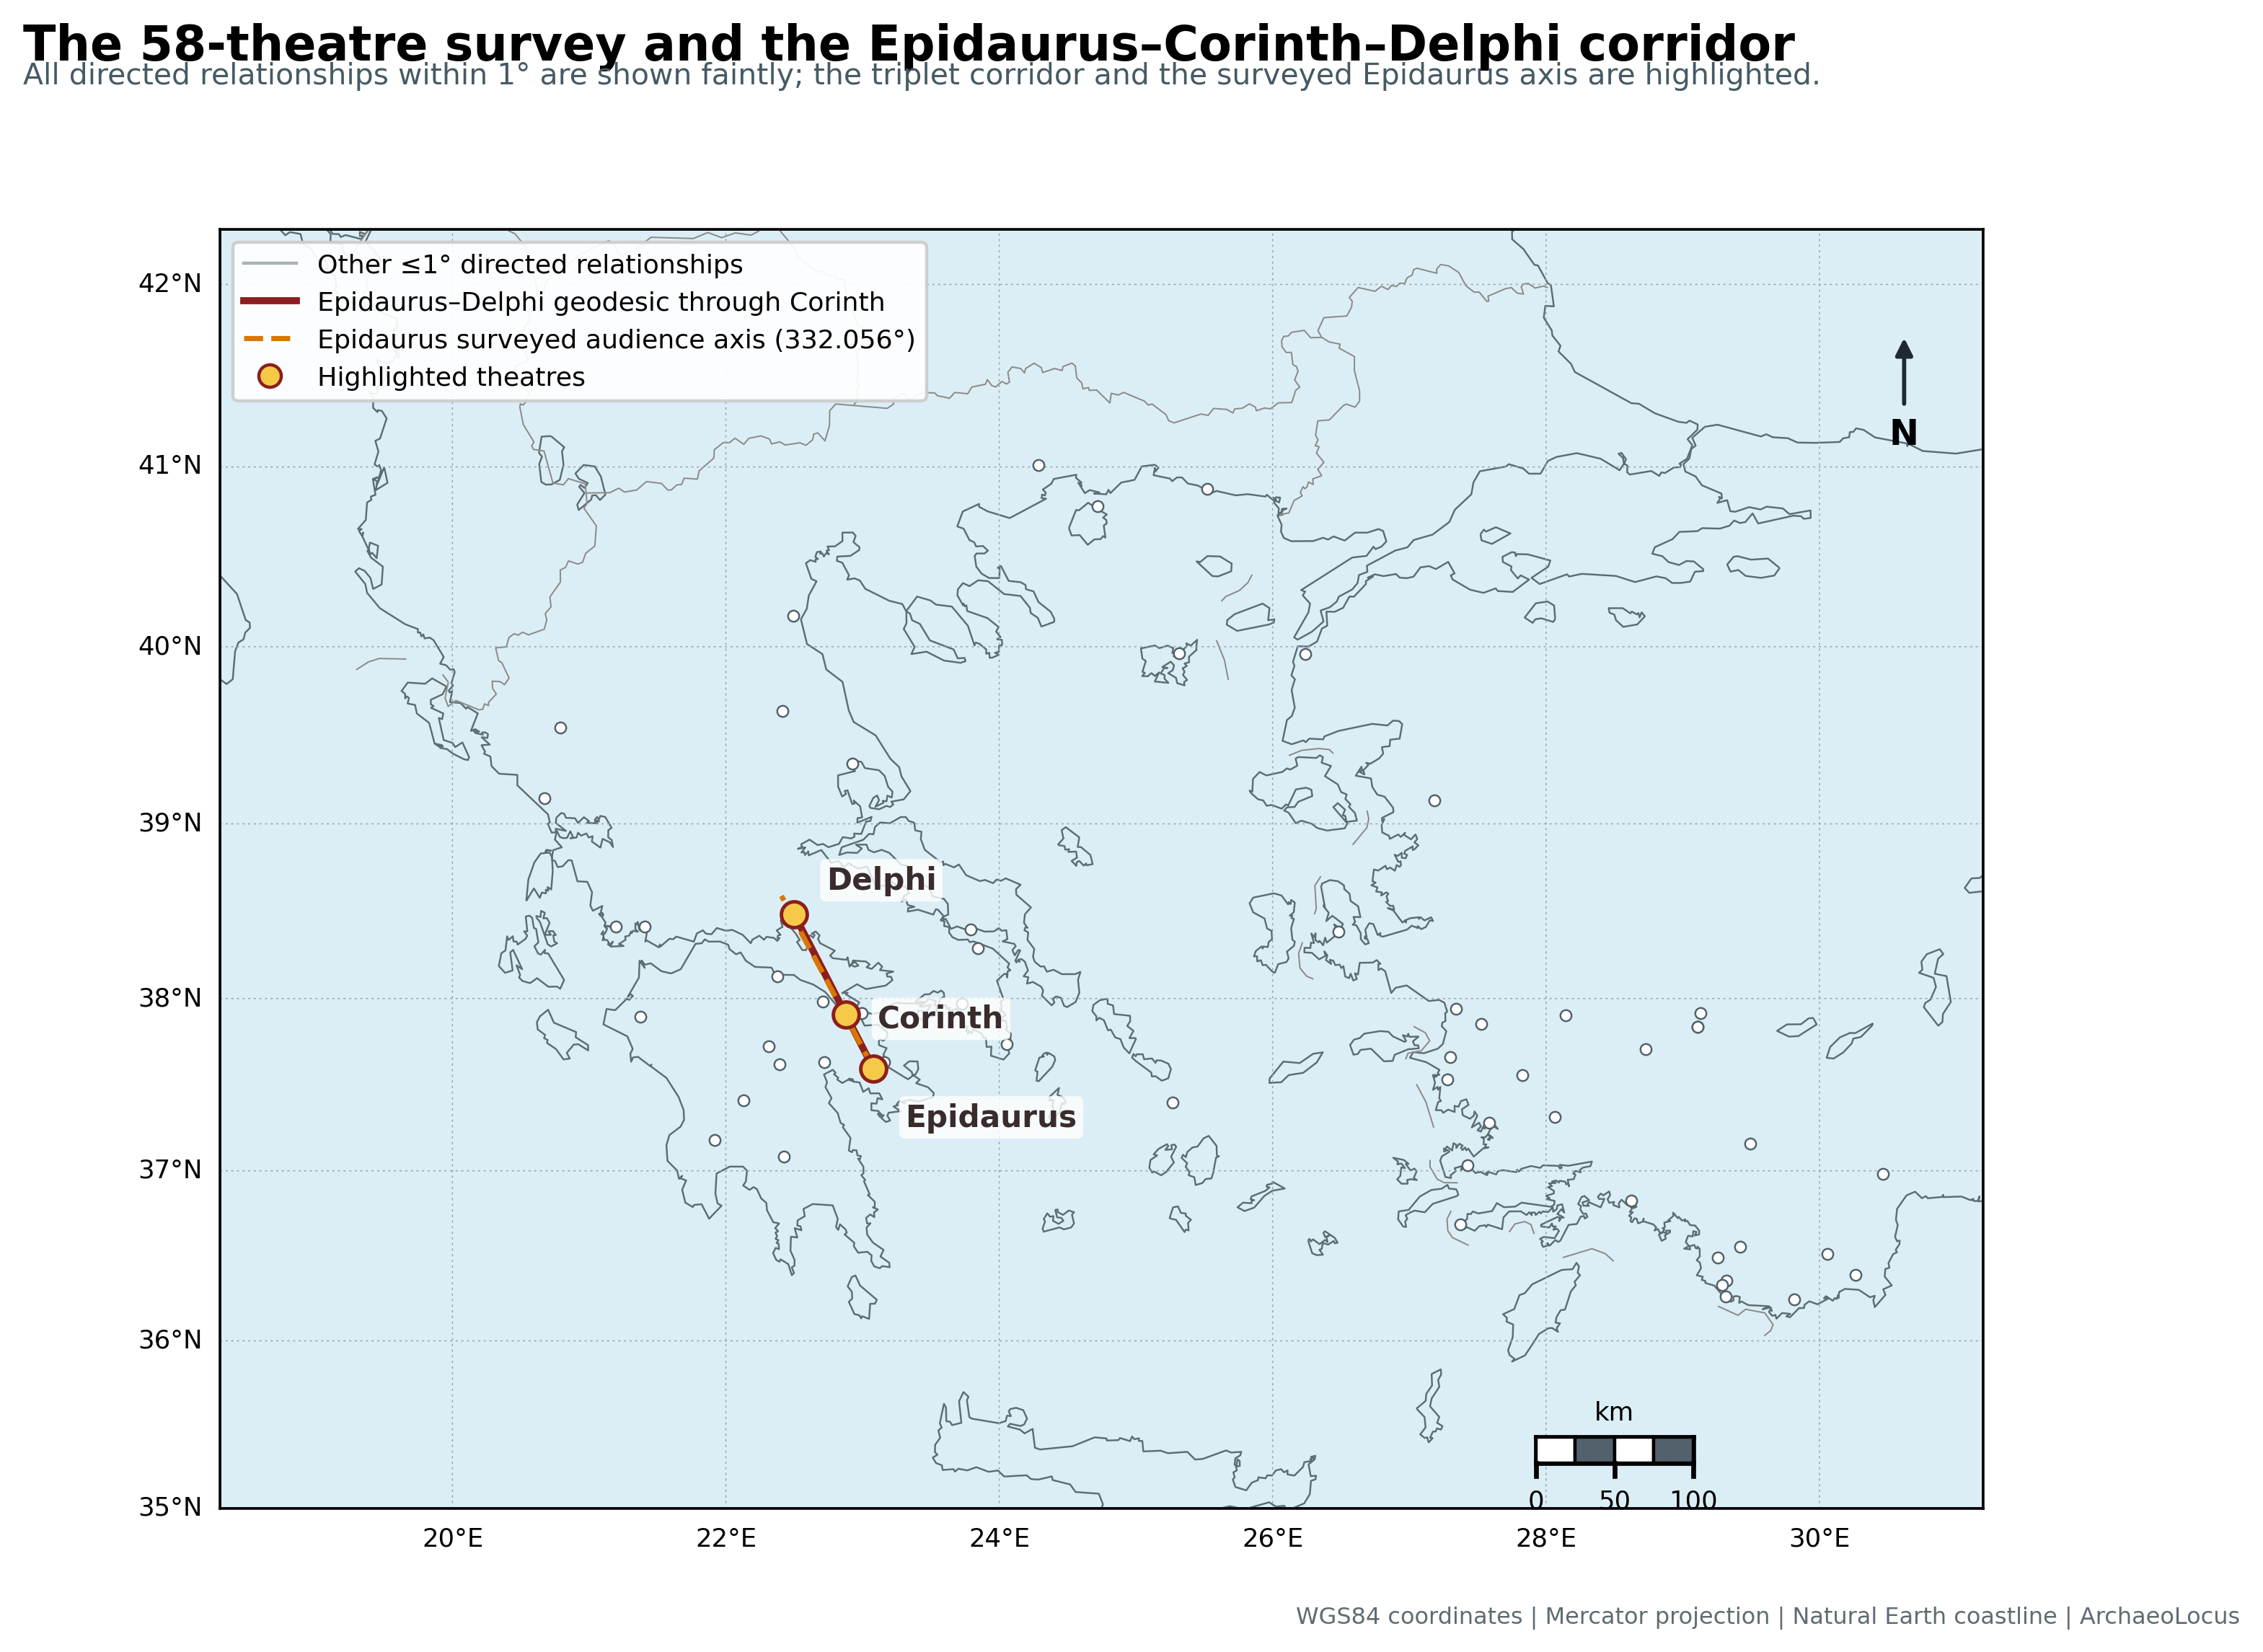
Theatre figures distinguish the centre-to-centre geodesic from the independently surveyed architectural axis and retain the full-corpus context.
View the Theatre Orientation project and its current evidence summary →
05
The evidence behind a figure
A publication map is only one layer of the evidential record. Where available and releasable, an ArchaeoLocus figure is supported by five linked components:
- Coordinate and identity record: what archaeological feature the point represents and where the coordinate came from.
- Measured geometry: distances, bearings, angular residuals, cross-track offsets or other defined quantities.
- Statistical output: the declared null model, simulation or permutation result and any multiple-testing correction.
- Robustness record: coordinate jitter, alternative representatives, holdouts, influence tests or negative controls where applicable.
- Interpretive limit: what the measurements do not establish archaeologically or historically.
06
Coordinate confidence and uncertainty
Map precision must not exceed coordinate precision. A line drawn to metre-level visual accuracy can be misleading when one of its archaeological points is only a site centroid or a coarse representative coordinate.
ArchaeoLocus therefore distinguishes monument-specific points from sanctuary, settlement, estate or general-place representatives; records alternative coordinates where justified; and uses sensitivity or jitter tests where coordinate uncertainty could affect the geometry.
07
Map and figure standard
Public ArchaeoLocus maps are intended to be calibrated and readable rather than decorative. Depending on scale and purpose they should carry an appropriate coastline or terrain context, labelled archaeological locations, a scale indication, coordinate reference information, a legend, measured values where necessary and a caption stating exactly what has been drawn.
Dense discovery maps are not automatically suitable for publication. Where a result can be explained more accurately by two or three simpler figures, the evidence is separated rather than compressed into one visually impressive diagram.
08
Release and reproducibility
The website presently publishes bounded evidence summaries and project-level measurements. Full-resolution manuscript figures, source tables, code, manifests and reproducibility packages will be linked here as individual publication routes permit.
Release decisions also consider third-party source licences and the sensitivity of precise archaeological coordinates. A reproducibility package should make the analytical result checkable without unnecessarily exposing protected or vulnerable locations.
Read the ArchaeoLocus method and reproducibility principles →
Public web figures are protected by copyright and may be watermarked or resolution-limited. © 2026 Eric C.B. Cauchi | ArchaeoLocus | All rights reserved. See Copyright and Terms of Use.
Maps and Evidence · website version v003 · 18 August 2026